##############################
##############################
import pymysql
import pandas as pd
import matplotlib.pyplot as plt
import numpy as np
##############################
## QUESTION 1 ##
##############################
# Connect to the world database
connection = pymysql.connect(
host = "dsc140.cmgtlybtlnmh.us-east-2.rds.amazonaws.com",
user = "guest",
password = "UMUdsc140",
db="world")
conn = connection.cursor()##############################
## QUESTION 2 ##
##############################
# Show all of the table names and format the returned data so it can be
# used later
show_tables = "SHOW TABLES"
output = conn.execute(show_tables)
table_names = conn.fetchall()
table_names = [i[0] for i in table_names]
print("Table Names")
print(table_names)
# For every table, print the names of the columns of data in the table
for table_name in table_names:
get_cols = "SHOW COLUMNS FROM "+table_name
output = conn.execute(get_cols)
col_names = conn.fetchall()
col_names = [i[0] for i in col_names]
print(table_name)
print(col_names)
print()Table Names
['City', 'Country', 'CountryLanguage']
City
['ID', 'Name', 'CountryCode', 'District', 'Population']
Country
['Code', 'Name', 'Continent', 'Region', 'SurfaceArea', 'IndepYear', 'Population', 'LifeExpectancy', 'GNP', 'GNPOld', 'LocalName', 'GovernmentForm', 'HeadOfState', 'Capital', 'Code2']
CountryLanguage
['CountryCode', 'Language', 'IsOfficial', 'Percentage']
##############################
##        QUESTION 3        ##
##############################
# Get the column names from the CountryLanguage Table
get_cols = "SHOW COLUMNS FROM CountryLanguage"
output = conn.execute(get_cols)
col_names = conn.fetchall()
col_names = [i[0] for i in col_names]

# Get the data from the CountryLanguage table
languages = "SELECT * FROM CountryLanguage"
output = conn.execute(languages)
data = conn.fetchall()

# Combine everything into a single dataframe
country_language = pd.DataFrame(data, columns=col_names)
country_language| CountryCode | Language | IsOfficial | Percentage | |
|---|---|---|---|---|
| 0 | ABW | Dutch | T | 5.3 |
| 1 | ABW | English | F | 9.5 |
| 2 | ABW | Papiamento | F | 76.7 |
| 3 | ABW | Spanish | F | 7.4 |
| 4 | AFG | Balochi | F | 0.9 |
| ... | ... | ... | ... | ... |
| 979 | ZMB | Tongan | F | 11.0 |
| 980 | ZWE | English | T | 2.2 |
| 981 | ZWE | Ndebele | F | 16.2 |
| 982 | ZWE | Nyanja | F | 2.2 |
| 983 | ZWE | Shona | F | 72.1 |
984 rows × 4 columns
##############################
##        QUESTION 4        ##
##############################
# Use an inner join to relate the name and region of the country from the Country table
# to the country language from the CountryLanguage table. Only keep results if the language
# is spanish
spanish_only = "SELECT c.Name, c.Region FROM Country c INNER JOIN CountryLanguage l \
    ON c.Code=l.CountryCode WHERE l.Language LIKE '%Spanish%'"
output = conn.execute(spanish_only)
data = conn.fetchall()
# Put the data in a dataframe, print the length of the dataframe and then the dataframe
spanish_countries = pd.DataFrame(data, columns=["Name", "Region"])
print("Number of Spanish Speaking Countries:", len(spanish_only))
spanish_countries
Number of Spanish Speaking Countries: 129| Name | Region | |
|---|---|---|
| 0 | Aruba | Caribbean |
| 1 | Andorra | Southern Europe |
| 2 | Argentina | South America |
| 3 | Belize | Central America |
| 4 | Bolivia | South America |
| 5 | Canada | North America |
| 6 | Chile | South America |
| 7 | Colombia | South America |
| 8 | Costa Rica | Central America |
| 9 | Cuba | Caribbean |
| 10 | Dominican Republic | Caribbean |
| 11 | Ecuador | South America |
| 12 | Spain | Southern Europe |
| 13 | France | Western Europe |
| 14 | Guatemala | Central America |
| 15 | Honduras | Central America |
| 16 | Mexico | Central America |
| 17 | Nicaragua | Central America |
| 18 | Panama | Central America |
| 19 | Peru | South America |
| 20 | Puerto Rico | Caribbean |
| 21 | Paraguay | South America |
| 22 | El Salvador | Central America |
| 23 | Sweden | Nordic Countries |
| 24 | Uruguay | South America |
| 25 | United States | North America |
| 26 | Venezuela | South America |
| 27 | Virgin Islands, U.S. | Caribbean |
##############################
## QUESTION 5 ##
##############################
# Get the column names from the Country table
get_cols = "SHOW COLUMNS FROM Country"
output = conn.execute(get_cols)
col_names = conn.fetchall()
col_names = [i[0] for i in col_names]
# Get the data from the Country table
languages = "SELECT * FROM Country"
output = conn.execute(languages)
data = conn.fetchall()
# Convert the retrieved data into a DataFrame
country = pd.DataFrame(data, columns=col_names)
# Drop null values
country = country.dropna()
# Extract all of the regions
regions = list(set(country['Region']))
# Create empty lists to store the average life expectancy and life
# expectancies for every country in a region
avg_life_expect = []
life_expect = []
# Iterate through every region
for region in regions:
# Create a sub-dataframe with only countries in a given region
region_data = country[country["Region"]==region]
# Temporary array to store the life expectancies of each country in a
# region
life_expect_temp = []
# Iterate through each country in a region
for i in range(len(region_data)):
# Save the life expectancy
life_expect_temp.append(region_data["LifeExpectancy"].iloc[i])
# Store the list of life expectancies and the average life expectancy for
# each region
life_expect.append(life_expect_temp)
avg_life_expect.append(np.mean(life_expect_temp))
# Sorted the saved data by average life expectancy
life_expect_sorted = sorted(zip(avg_life_expect,regions,life_expect))
# Extract, in order of increasing average life expectancy, the list of
# life expectancies and the region
life_expect_sorted_data = []
sorted_regions = []
for row in life_expect_sorted:
avg, region, data = row
sorted_regions.append(region)
life_expect_sorted_data.append(data)
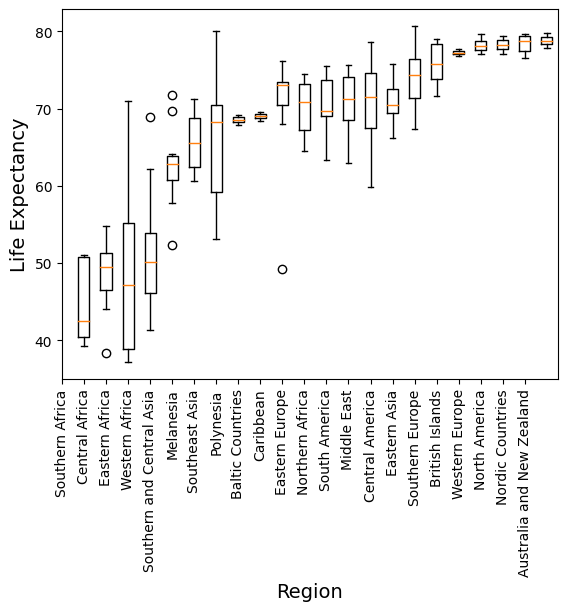
# Create a boxplot of the life expectancy data
plt.boxplot(life_expect_sorted_data)
# Change the x-ticks, add x and y labels
plt.xticks(range(len(sorted_regions)), sorted_regions, rotation=90)
plt.xlabel('Region', fontsize=14)
plt.ylabel("Life Expectancy", fontsize=14)Text(0, 0.5, 'Life Expectancy')