Python Homework Part 1
The code you submit for this homework must following the coding guidelines.
Part 1
Consider the following problems. Submit a single Jupyter Notebook file to the D2L Dropbox; solve each problem in a different cell.
Problem 1 (4 pts.)
Evaluate the following expressions. In a comment inside the cell, briefly explain the calculation. (For example, for an expression 2**3/2, you might say “#Calculate 2**3 = 8, then 8/2 =4”.)
- 10//5+2
- 2**3**2
- 2/4+3/6
Problem 2 (4 pts.)
Start with the following line of code:
x = “Daily Closing Price (US dollars)”
Then, use a series of string methods to transform x into a string such that print(x) yields the following:
daily closing price
Problem 3 (8 pts.)
Start with the following list:
x = [4,8,12,8,2]
When performing statistics, we are often interested in rescaling the values. Generate a list whose entries are equal to the entries in x each divided by the maximum value in x. Answer:
[0.333, 0.666, 1.0, 0.666, 0.166]
These are rounded to 3 digits after the decimal so they’re easier to read, but you don’t need to round them in your own work.
Problem 4 (8 pts.)
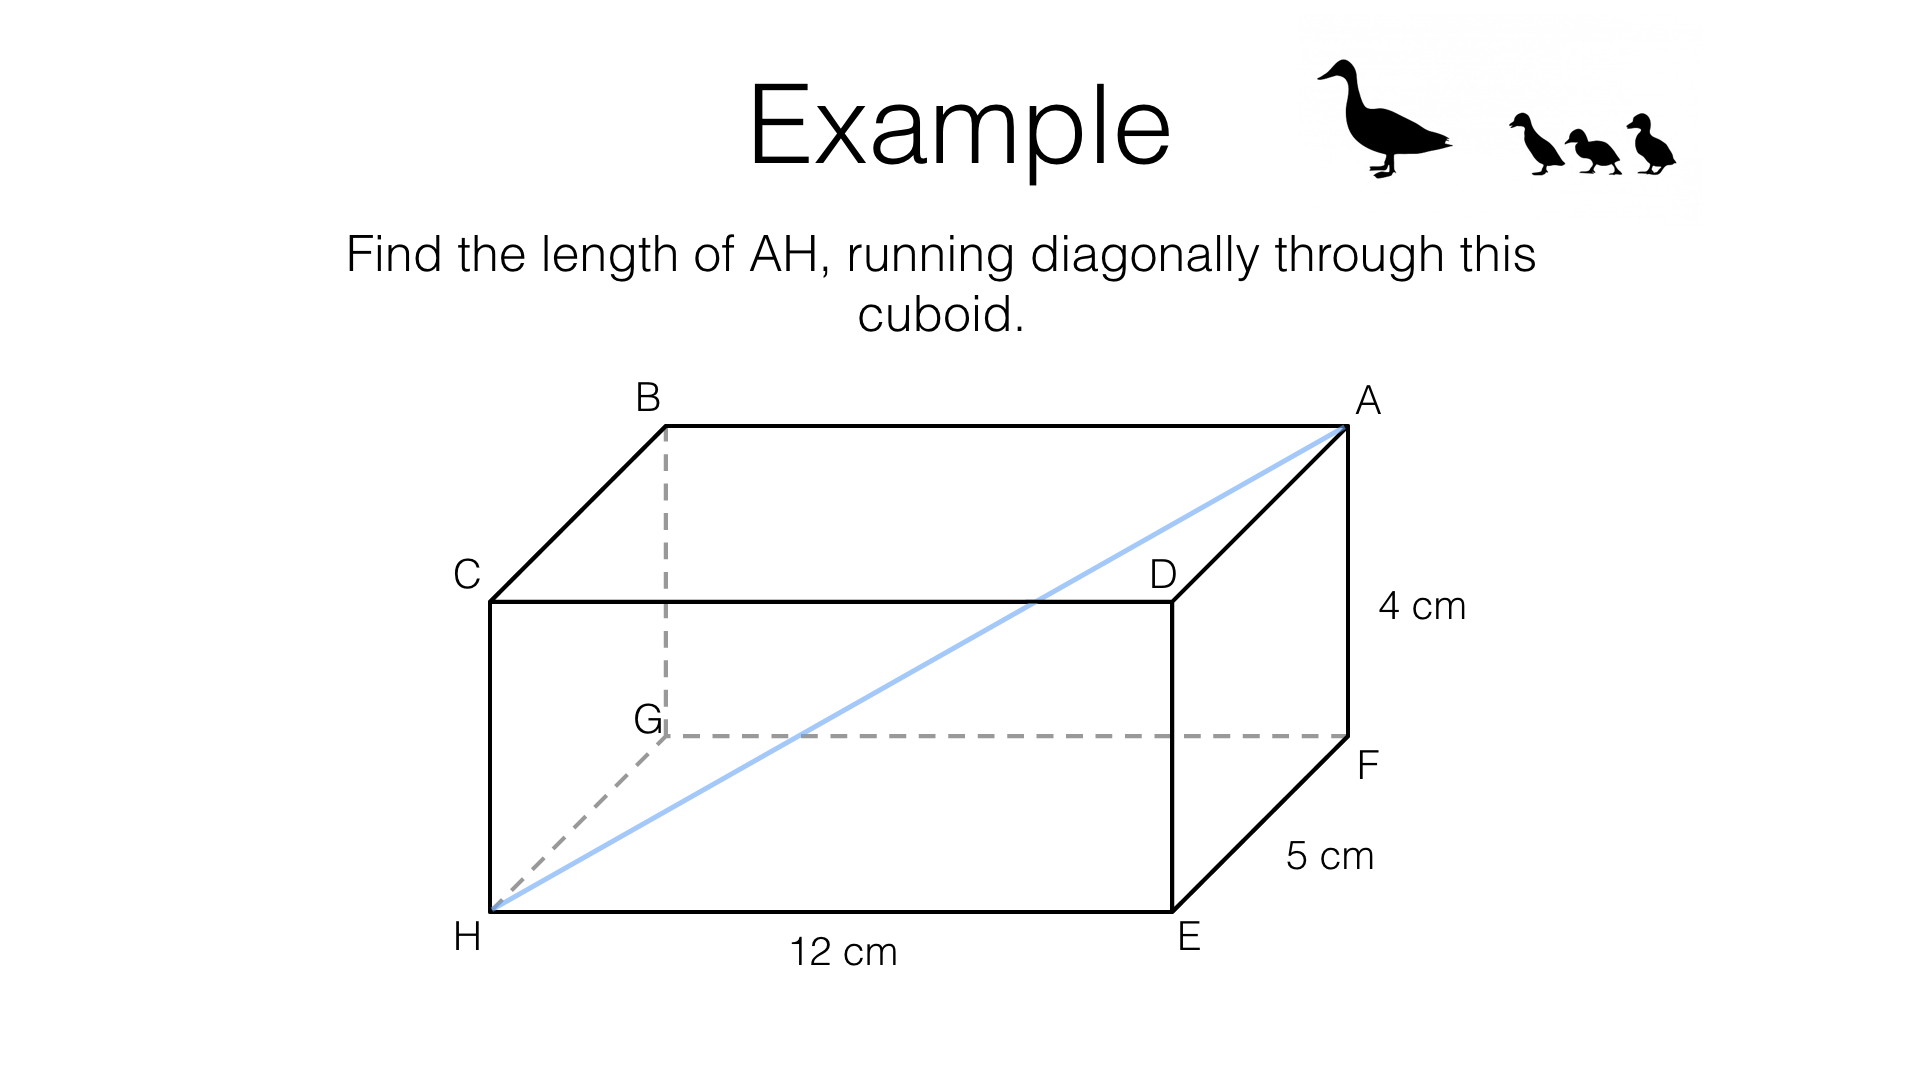
Define a function that takes three arguments a, b, and c and returns the value h, where
\[h = (a^2 + b^2 + c^2)^{\frac{1}{2}}\]
This is the three-dimensional version of the Pythagorean Theorem. Use your function to report the length of AH below, where a=12cm, b=5cm, and c=4cm. (Image from bossmaths.com.)
Part 2
Problem 1 (8 pts.)
Consider the file insurance_claim_updated_short.csv.
- Write a Python program to make a scatter plot between the total claim amount column and the policy annual premium column. Label your axes and adjust the details of the scatter plot (symbols, size, and color) to your taste.
- Calculate the correlation coefficient and report the value with an appropriate print() command.
- Include a line of best fit on the graph (i.e., perform a linear regression.)
- In a comment, respond to the following question: “Do these data suggest that it is a good idea to have insurance?” (Just a sentence or two interpreting your graph is sufficient.)
Hint: You’ll find that there are some rows of “empty” data in the file. You can eliminate them from a dataframe with
df = df.dropna()