##############################
##          IMPORTS         ##
##############################
import numpy as np
import pandas as pd
import seaborn as sns
import matplotlib.pyplot as plt
from sklearn.datasets import load_iris
from sklearn.metrics import confusion_matrix
from sklearn.preprocessing import StandardScaler
from sklearn.linear_model import RidgeClassifier
from sklearn.model_selection import train_test_splitClassification Problems
CSC/DSC 340 Week 4 Slides
Author: Dr. Julie Butler
Date Created: August 13, 2023
Last Modified: August 14, 2023
What are Classification Problems?
- Goal: Determine what “class” a data point belongs to
- Regression: output can be any real number
- Classification: output can only be taken from finite and discrete set
Classification Examples
- Can the condition of a car be determined from its price and odometer reading?
- Can the species of a plant or animal be determined from various measurements?
- Can the sex of an animal be determined from various measurements?
- Can handwritten numbers be converted to text (MNIST Data Set)?
- Can pictures of clothes be identified?
- Can pictures be determined to contain dogs or cats?
Types of Classification Problems
- Binimal Classifier: data is sorted into one of two categories
- Multiclass Classifier: data is sorted into one of three or more categories
- Multilabel Classifier: data can belong to more than one category
Classifiers
- Ridge Classifier (this week)
- Stochastic Gradient Descent (Hands-On Chapter 3)
- Support Vector Machines (not covered)
- Neural Networks/Convolutional Neural Networks (covered later)
Ridge Classifier
- Scikit-Learn implementation
- Using ridge regression but converts it into a classification problem
- Binomial classification
- Inputs are mapped to outputs between -1 and 1
- Class 0 corresponds to a negative output and class 1 corresponds to a positive output
- Multiclass classification
- Treat as multi-output regression problem and output with higest value is the category
- Simple classification algorithm but computationally effecient
Error Metrics
- The error metrics we have mean using are not suitable to determine the performance of a classifier
- New error metrics
- Accuracy Score
- Confusion Matrix
- Other error metrics are covered in Chapter 3 of Hands-On Machine Learning
Accuracy Score
\[ Score = \frac{Number\ of\ Correct\ Predictions}{Total\ Number\ of\ Data\ Points}\]
- A score of 1.0 means 100% of the predictions are classified correctly
- A score of 0.0 means 0% of the predictions are classified correctly
Confusion Matrix
- Each row represents an actual class, each column represents a predicted class
- Numbers of the main diagonal are correct predictions and numbers on the off diagonal elements are in correct predictions
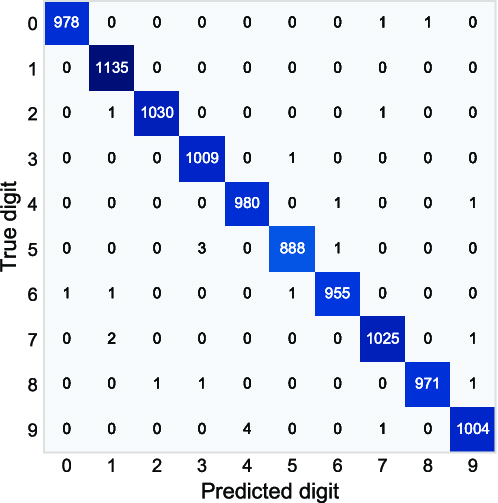 Image Source
Example: The Iris Data Set and the Ridge Classifier
 * The Iris Data Set is a famous classification data set * Each point contains measurements of different parts of the flower and the specific variety of iris it belongs to * Goal is to predict what type of iris each flower is * Image Source
# Load the iris dataset from sklearn
iris = load_iris()

# Convert the iris dataset to a pandas dataframe
iris_data = pd.DataFrame(iris.data, columns=iris.feature_names)

# Add the target variable to the dataframe
iris_data['target'] = iris.target
# Determine what data the iris data set contains
iris_data| sepal length (cm) | sepal width (cm) | petal length (cm) | petal width (cm) | target | |
|---|---|---|---|---|---|
| 0 | 5.1 | 3.5 | 1.4 | 0.2 | 0 |
| 1 | 4.9 | 3.0 | 1.4 | 0.2 | 0 |
| 2 | 4.7 | 3.2 | 1.3 | 0.2 | 0 |
| 3 | 4.6 | 3.1 | 1.5 | 0.2 | 0 |
| 4 | 5.0 | 3.6 | 1.4 | 0.2 | 0 |
| ... | ... | ... | ... | ... | ... |
| 145 | 6.7 | 3.0 | 5.2 | 2.3 | 2 |
| 146 | 6.3 | 2.5 | 5.0 | 1.9 | 2 |
| 147 | 6.5 | 3.0 | 5.2 | 2.0 | 2 |
| 148 | 6.2 | 3.4 | 5.4 | 2.3 | 2 |
| 149 | 5.9 | 3.0 | 5.1 | 1.8 | 2 |
150 rows × 5 columns
# Create a pairplot with the color of each dot corresponding to the type of iris
sns.pairplot(iris_data, hue='target')
C:\Users\butlerju\AppData\Local\Programs\Python\Python311\Lib\site-packages\seaborn\axisgrid.py:118: UserWarning: The figure layout has changed to tight
self._figure.tight_layout(*args, **kwargs)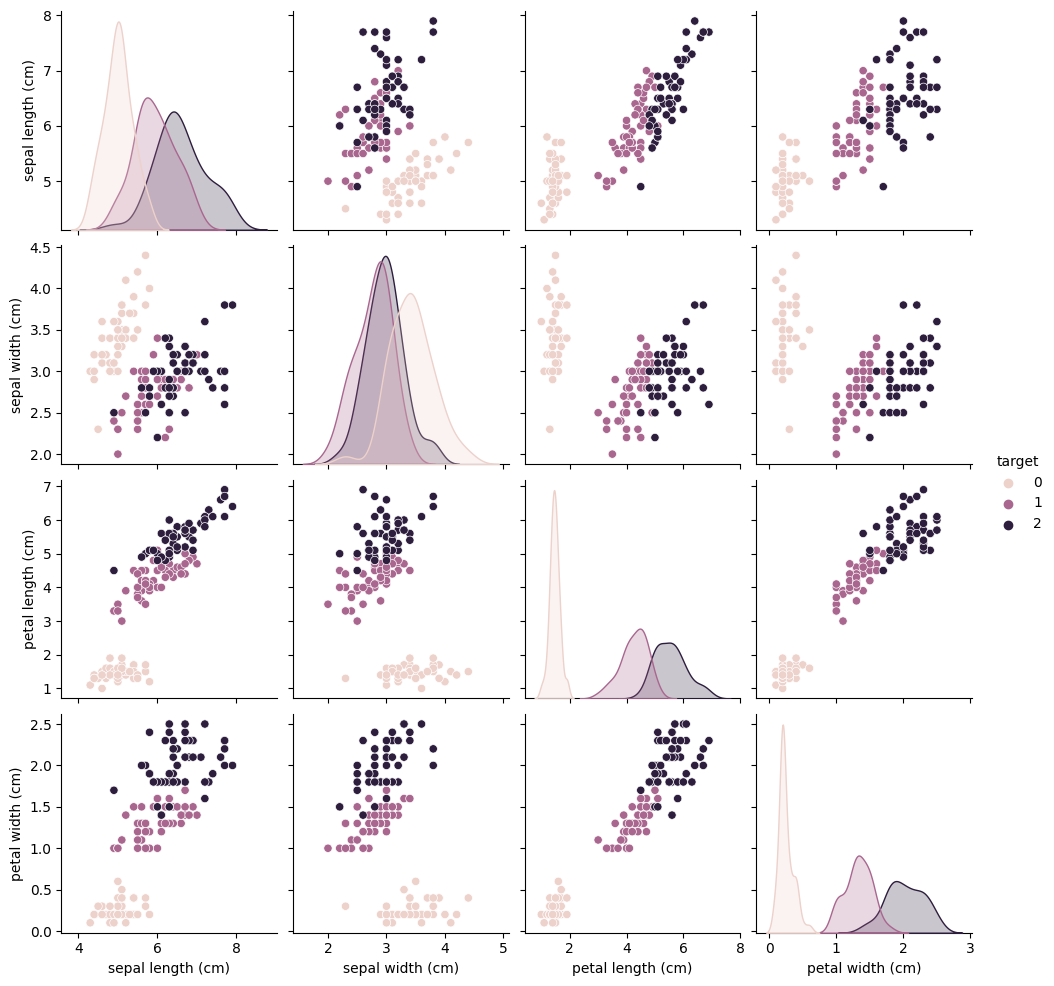
# Features are the inputs/X-data
features = iris_data.drop(columns=['target'])

# labels are the outputs/y-data/targets
labels = iris_data['target']
# Splot the data into training and test data sets
X_train, X_test, y_train, y_test = train_test_split(features, labels, test_size=0.2)# Define, train, and predict with a ridge classifier
ridge_classifier = RidgeClassifier()
ridge_classifier.fit(X_train, y_train)
y_pred = ridge_classifier.predict(X_test)# Calculate the accuracy score, where 1.0 means 100% of predictions are correct
print(ridge_classifier.score(X_test, y_test))0.8666666666666667# Print out a confusion matrix
confusion_matrix(y_test, y_pred)array([[ 6, 0, 0],
[ 0, 8, 3],
[ 0, 1, 12]], dtype=int64)# Display the confusion matrix in a better way with matshow
confusion = confusion_matrix(y_test, y_pred)
plt.matshow(confusion, cmap='summer')
plt.colorbar()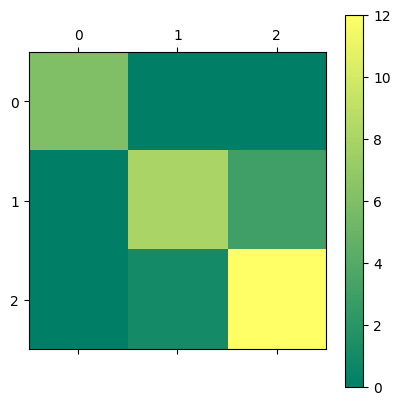
# Since RidgeClassifier is a regularized method, attempt to improve performance
# by scaling the results
scaler = StandardScaler()
scaler.fit(features)
features_Z = scaler.transform(features)

X_train, X_test, y_train, y_test = train_test_split(features_Z, labels, test_size=0.2)

ridge_classifier = RidgeClassifier()
ridge_classifier.fit(X_train, y_train)
y_pred = ridge_classifier.predict(X_test)

print(ridge_classifier.score(X_test, y_test))

confusion = confusion_matrix(y_test, y_pred)

plt.matshow(confusion, cmap='summer')
plt.colorbar()
0.7666666666666667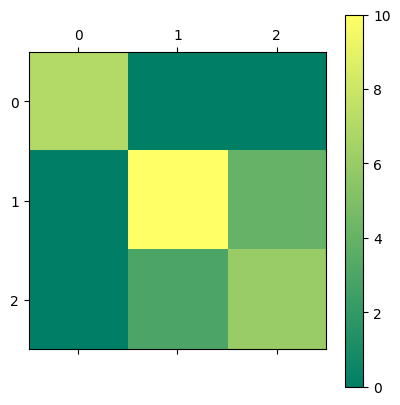
# Attempt to improve the performance with hyperparameter tuning
best_score = 0
best_alpha = None
for alpha in np.logspace(-5, 2, 5000):
    ridge_classifier = RidgeClassifier(alpha = alpha)
    ridge_classifier.fit(X_train, y_train)
    y_pred = ridge_classifier.predict(X_test)

    score = ridge_classifier.score(X_test, y_test)

    if score > best_score:
        best_score = score
        best_alpha = alpha

print('BEST ALPHA:', best_alpha)
print('BEST SCORE:', best_score)
BEST ALPHA: 1.7039085778543699
BEST SCORE: 0.8Potential Problems with Classification Data Sets
- There may not be clear differences between the different categories; may need a powerful classification algorithm
- Data sets may represent categorical data as text (LabelEncoder)