Classification Problems#
CSC/DSC 340 Week 4 Slides
Author: Dr. Julie Butler
Date Created: August 13, 2023
Last Modified: August 14, 2023
What are Classification Problems?#
Goal: Determine what “class” a data point belongs to
Regression: output can be any real number
Classification: output can only be taken from finite and discrete set
Classification Examples#
Can the condition of a car be determined from its price and odometer reading?
Can the species of a plant or animal be determined from various measurements?
Can the sex of an animal be determined from various measurements?
Can handwritten numbers be converted to text (MNIST Data Set)?
Can pictures of clothes be identified?
Can pictures be determined to contain dogs or cats?
Types of Classification Problems#
Binimal Classifier: data is sorted into one of two categories
Multiclass Classifier: data is sorted into one of three or more categories
Multilabel Classifier: data can belong to more than one category
Classifiers#
Ridge Classifier (this week)
Stochastic Gradient Descent (Hands-On Chapter 3)
Support Vector Machines (not covered)
Neural Networks/Convolutional Neural Networks (covered later)
Ridge Classifier#
Scikit-Learn implementation
Using ridge regression but converts it into a classification problem
Binomial classification
Inputs are mapped to outputs between -1 and 1
Class 0 corresponds to a negative output and class 1 corresponds to a positive output
Multiclass classification
Treat as multi-output regression problem and output with higest value is the category
Simple classification algorithm but computationally effecient
Error Metrics#
The error metrics we have mean using are not suitable to determine the performance of a classifier
New error metrics
Accuracy Score
Confusion Matrix
Other error metrics are covered in Chapter 3 of Hands-On Machine Learning
Accuracy Score#
A score of 1.0 means 100% of the predictions are classified correctly
A score of 0.0 means 0% of the predictions are classified correctly
Confusion Matrix#
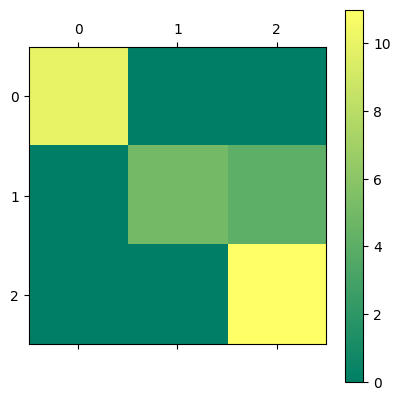
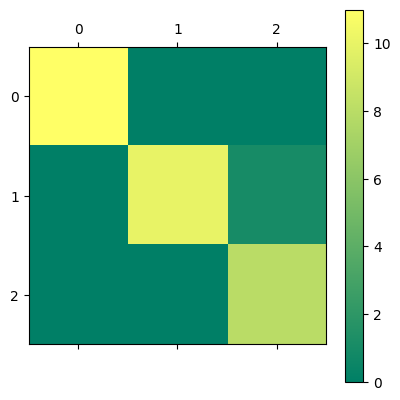
Each row represents an actual class, each column represents a predicted class
Numbers of the main diagonal are correct predictions and numbers on the off diagonal elements are in correct predictions
 Image Source
Example: The Iris Data Set and the Ridge Classifier#

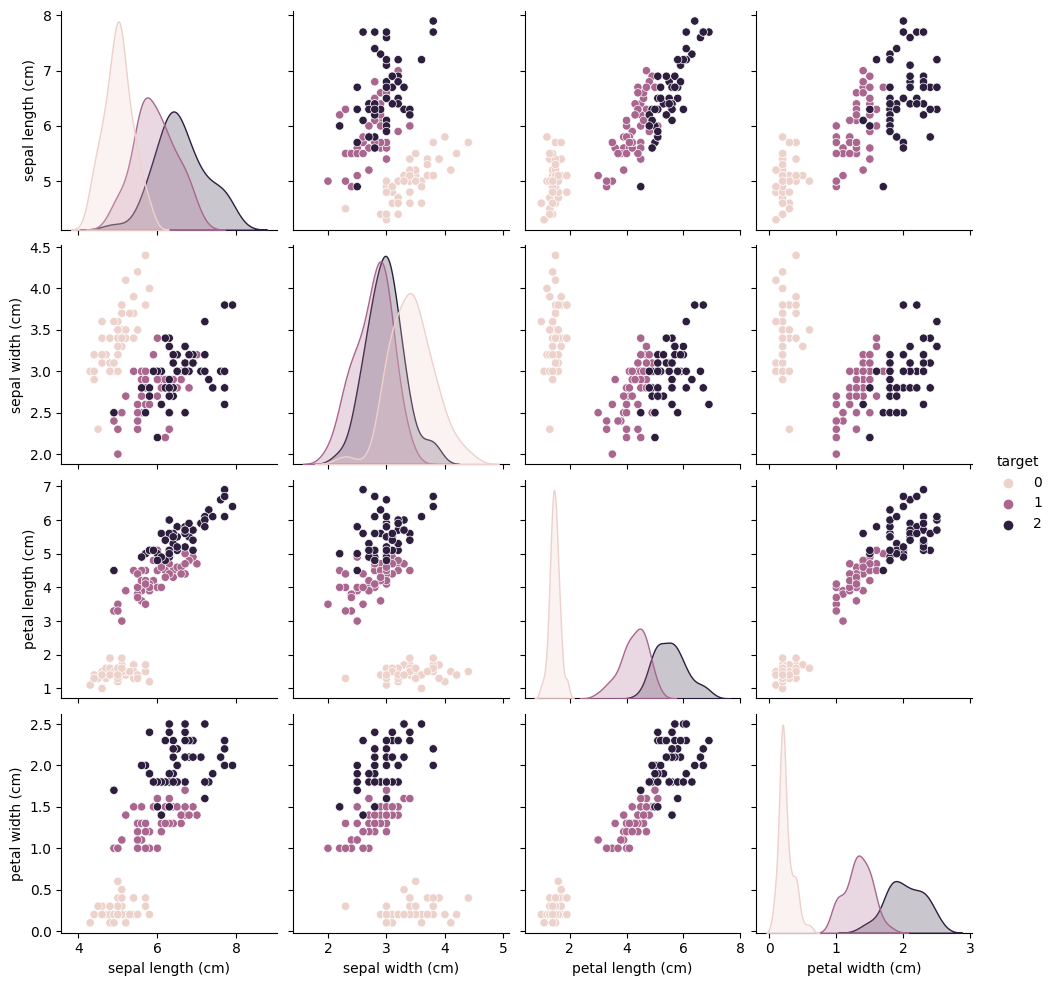
The Iris Data Set is a famous classification data set
Each point contains measurements of different parts of the flower and the specific variety of iris it belongs to
Goal is to predict what type of iris each flower is
##############################
##          IMPORTS         ##
##############################
import numpy as np
import pandas as pd
import seaborn as sns
import matplotlib.pyplot as plt
from sklearn.datasets import load_iris
from sklearn.metrics import confusion_matrix
from sklearn.preprocessing import StandardScaler
from sklearn.linear_model import RidgeClassifier
from sklearn.model_selection import train_test_split
# Load the iris dataset from sklearn
iris = load_iris()

# Convert the iris dataset to a pandas dataframe
iris_data = pd.DataFrame(iris.data, columns=iris.feature_names)

# Add the target variable to the dataframe
iris_data['target'] = iris.target
# Determine what data the iris data set contains
iris_data
| sepal length (cm) | sepal width (cm) | petal length (cm) | petal width (cm) | target | |
|---|---|---|---|---|---|
| 0 | 5.1 | 3.5 | 1.4 | 0.2 | 0 |
| 1 | 4.9 | 3.0 | 1.4 | 0.2 | 0 |
| 2 | 4.7 | 3.2 | 1.3 | 0.2 | 0 |
| 3 | 4.6 | 3.1 | 1.5 | 0.2 | 0 |
| 4 | 5.0 | 3.6 | 1.4 | 0.2 | 0 |
| ... | ... | ... | ... | ... | ... |
| 145 | 6.7 | 3.0 | 5.2 | 2.3 | 2 |
| 146 | 6.3 | 2.5 | 5.0 | 1.9 | 2 |
| 147 | 6.5 | 3.0 | 5.2 | 2.0 | 2 |
| 148 | 6.2 | 3.4 | 5.4 | 2.3 | 2 |
| 149 | 5.9 | 3.0 | 5.1 | 1.8 | 2 |
150 rows × 5 columns
# Create a pairplot with the color of each dot corresponding to the type of iris
sns.pairplot(iris_data, hue='target')
/Users/juliehartley/Library/Python/3.9/lib/python/site-packages/seaborn/axisgrid.py:118: UserWarning: The figure layout has changed to tight
  self._figure.tight_layout(*args, **kwargs)
<seaborn.axisgrid.PairGrid at 0x156cb47c0>

# Features are the inputs/X-data
features = iris_data.drop(columns=['target'])

# labels are the outputs/y-data/targets
labels = iris_data['target']
# Splot the data into training and test data sets
X_train, X_test, y_train, y_test = train_test_split(features, labels, test_size=0.2)
# Define, train, and predict with a ridge classifier
ridge_classifier = RidgeClassifier()
ridge_classifier.fit(X_train, y_train)
y_pred = ridge_classifier.predict(X_test)
# Calculate the accuracy score, where 1.0 means 100% of predictions are correct
print(ridge_classifier.score(X_test, y_test))
0.8666666666666667
# Print out a confusion matrix
confusion_matrix(y_test, y_pred)
array([[10,  0,  0],
       [ 0,  5,  4],
       [ 0,  0, 11]])
# Display the confusion matrix in a better way with matshow
confusion = confusion_matrix(y_test, y_pred)
plt.matshow(confusion, cmap='summer')
plt.colorbar()
<matplotlib.colorbar.Colorbar at 0x157642340>

# Since RidgeClassifier is a regularized method, attempt to improve performance
# by scaling the results
scaler = StandardScaler()
scaler.fit(features)
features_Z = scaler.transform(features)

X_train, X_test, y_train, y_test = train_test_split(features_Z, labels, test_size=0.2)

ridge_classifier = RidgeClassifier()
ridge_classifier.fit(X_train, y_train)
y_pred = ridge_classifier.predict(X_test)

print(ridge_classifier.score(X_test, y_test))

confusion = confusion_matrix(y_test, y_pred)

plt.matshow(confusion, cmap='summer')
plt.colorbar()
0.9666666666666667
<matplotlib.colorbar.Colorbar at 0x157642670>

# Attempt to improve the performance with hyperparameter tuning
best_score = 0
best_alpha = None
for alpha in np.logspace(-5, 2, 5000):
    ridge_classifier = RidgeClassifier(alpha = alpha)
    ridge_classifier.fit(X_train, y_train)
    y_pred = ridge_classifier.predict(X_test)

    score = ridge_classifier.score(X_test, y_test)

    if score > best_score:
        best_score = score
        best_alpha = alpha

print('BEST ALPHA:', best_alpha)
print('BEST SCORE:', best_score)
BEST ALPHA: 1e-05
BEST SCORE: 0.9666666666666667
Potential Problems with Classification Data Sets#
There may not be clear differences between the different categories; may need a powerful classification algorithm
Data sets may represent categorical data as text (LabelEncoder)
